
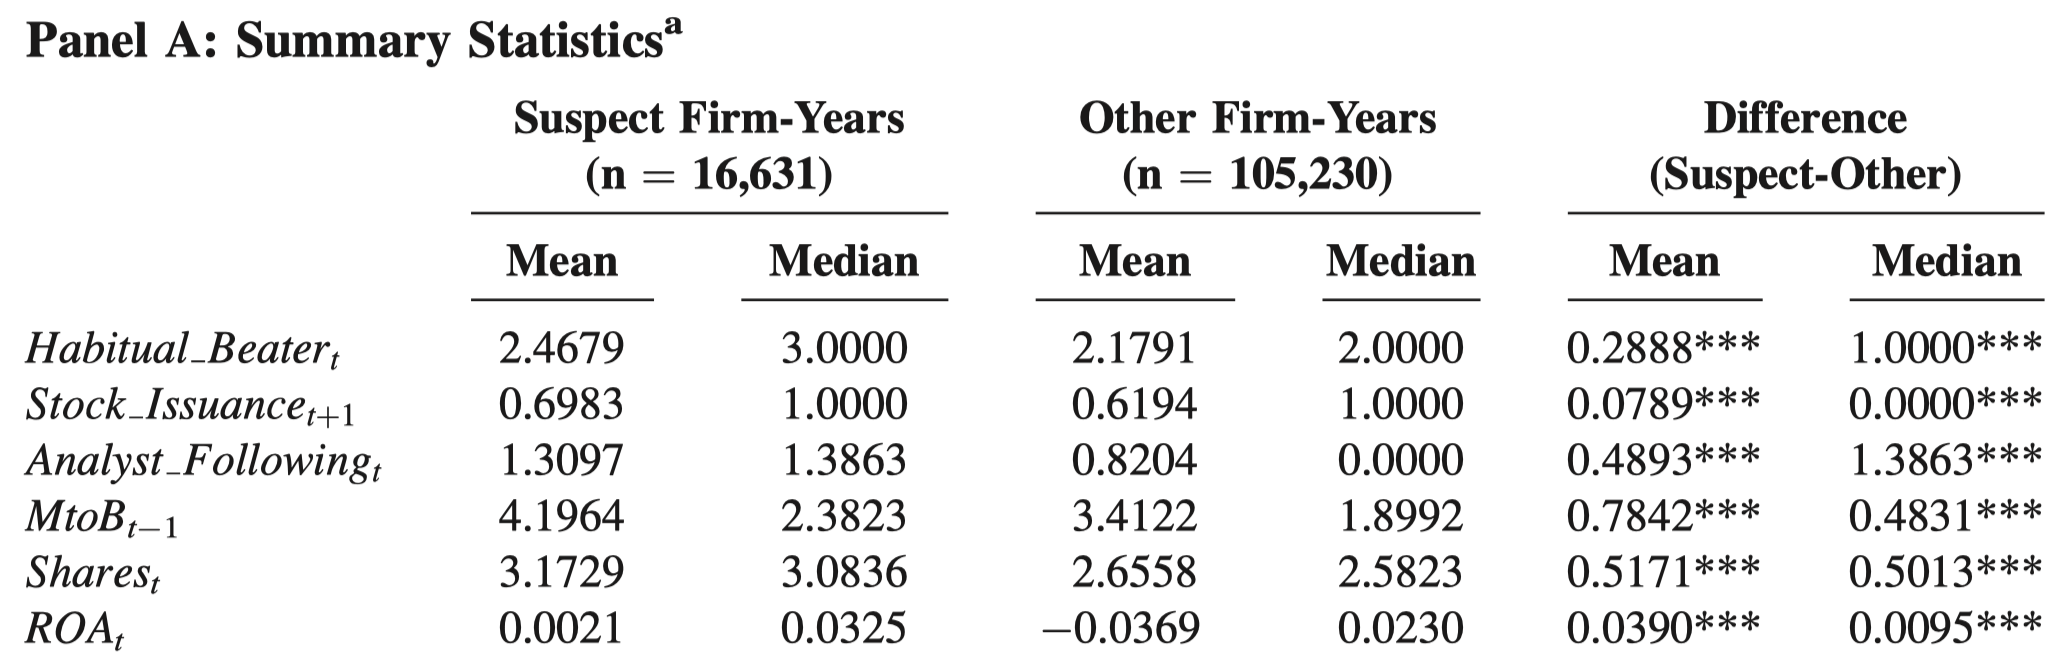
Sometimes we may want to produce the following table to compare the mean and median of two groups:
First of all, please refer to this post to see Stata commands to test equality of mean and median.
However, it is time-consuming to glean numbers from the output of these Stata commands and place them in a table. It is even more struggling that you have to repeat the tedious process every time you update your sample.
I write Stata codes to streamline the process. The codes vary between unpaired (i.e., unmatched) data and paired data.
Unpaired data
The above example is unpaired data, i.e., suspect firm-years and other firm-years are not 1-to-1 or 1-to-m matched. One usage of unpaired data is the first step of Heckman’s two-step procedure, in which two groups of observations (i.e., the group that will be selected into the second step and the group that will not be selected into the second step) are stacked vertically in the dataset. The following codes are used for unpaired data. You only need to modify the first two lines to suit your data. The codes will generate a table in Stata’s output window like this:
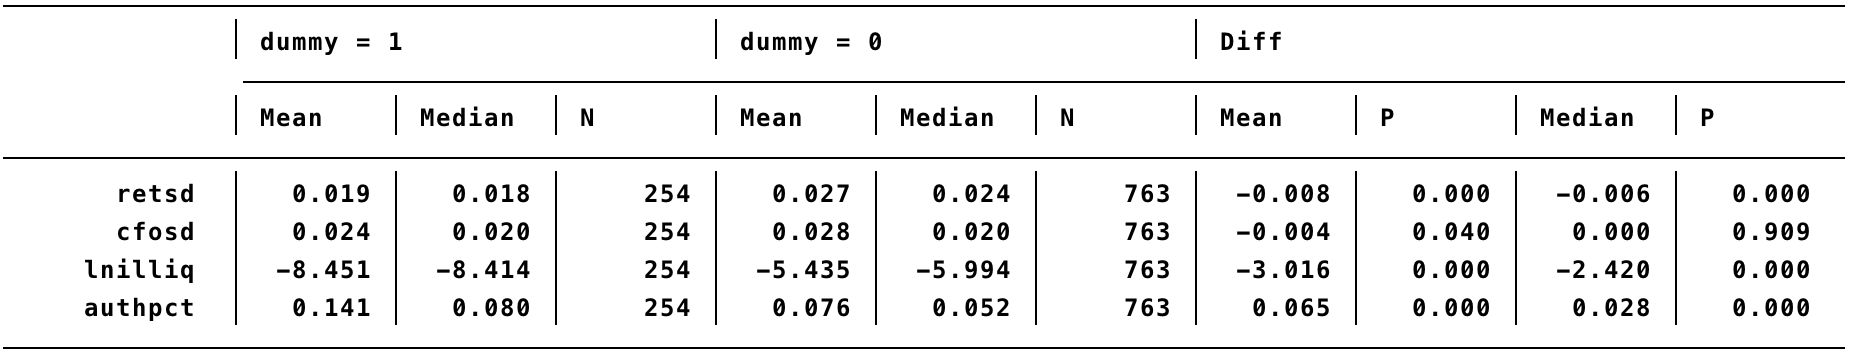
You can then select the output and right-click “Copy as table” and paste in Excel for a quick edit. The codes use t-test for mean and Wilcoxon rank-sum test for median.
|
1 2 3 4 5 6 7 8 9 10 11 12 13 14 15 16 17 18 19 20 21 22 23 24 25 26 27 28 29 30 31 32 33 34 35 36 37 38 39 40 41 42 43 44 45 46 47 48 49 50 51 52 53 54 55 56 57 |
local vars retsd cfosd lnilliq authpct //put your variables here local group grpid //"grpid" is your group indicator that takes 1 and 0 foreach v in `vars' { di "`v'" ttest `v', by(`group') local mean_`v'_mean_0=round(r(mu_1),.001) local mean_`v'_mean_1=round(r(mu_2),.001) local mean_`v'_diff=`mean_`v'_mean_1'-`mean_`v'_mean_0' local mean_`v'_p=r(p) } foreach v in `vars' { sum `v' if `group'==0, detail local p50_`v'_p50_0=round(r(p50),.001) sum `v' if `group'==1, detail local p50_`v'_p50_1=round(r(p50),.001) ranksum `v', by(`group') local p50_`v'_n_0=r(N_1) local p50_`v'_n_1=r(N_2) local p50_`v'_diff=`p50_`v'_p50_1'-`p50_`v'_p50_0' local p50_`v'_p=2*normprob(-abs(r(z))) } qui { noi di _newline noi di "{hline 115}" noi di _col(15) "{c |} `group' = 1" /// _col(45) "{c |} `group' = 0" /// _col(75) "{c |} Diff" noi di _col(16) "{hline 100}" noi di _col(15) "{c |} Mean" /// _col(25) "{c |} Median" /// _col(35) "{c |} N" /// _col(45) "{c |} Mean" /// _col(55) "{c |} Median" /// _col(65) "{c |} N" /// _col(75) "{c |} Mean" /// _col(85) "{c |} P" /// _col(95) "{c |} Median" /// _col(105) "{c |} P" noi di "{hline 115}" foreach v in `vars' { noi di %12s abbrev("`v'",12) /// _col(15) "{c |}" %8.3f `mean_`v'_mean_1' /// _col(25) "{c |}" %8.3f `p50_`v'_p50_1' /// _col(35) "{c |}" %8.0f `p50_`v'_n_1' /// _col(45) "{c |}" %8.3f `mean_`v'_mean_0' /// _col(55) "{c |}" %8.3f `p50_`v'_p50_0' /// _col(65) "{c |}" %8.0f `p50_`v'_n_0' /// _col(75) "{c |}" %8.3f `mean_`v'_diff' /// _col(85) "{c |}" %8.3f `mean_`v'_p' /// _col(95) "{c |}" %8.3f `p50_`v'_diff' /// _col(105) "{c |}" %8.3f `p50_`v'_p' } noi di "{hline 115}" } |
Paired data
A typical usage of paired data is to identify a matched control group for the treatment group. For example, identify a matched firm-year for an event firm-year based on a set of characteristics (same industry, same year, similar size and book-to-market), or identify a matched firm for every event firm based on the closest propensity score (i.e., propensity score matching).
The following table is an example that compares the mean and median of two matched groups—restating firms and non-restating group. Each restating firm is matched with a non-restating firm.
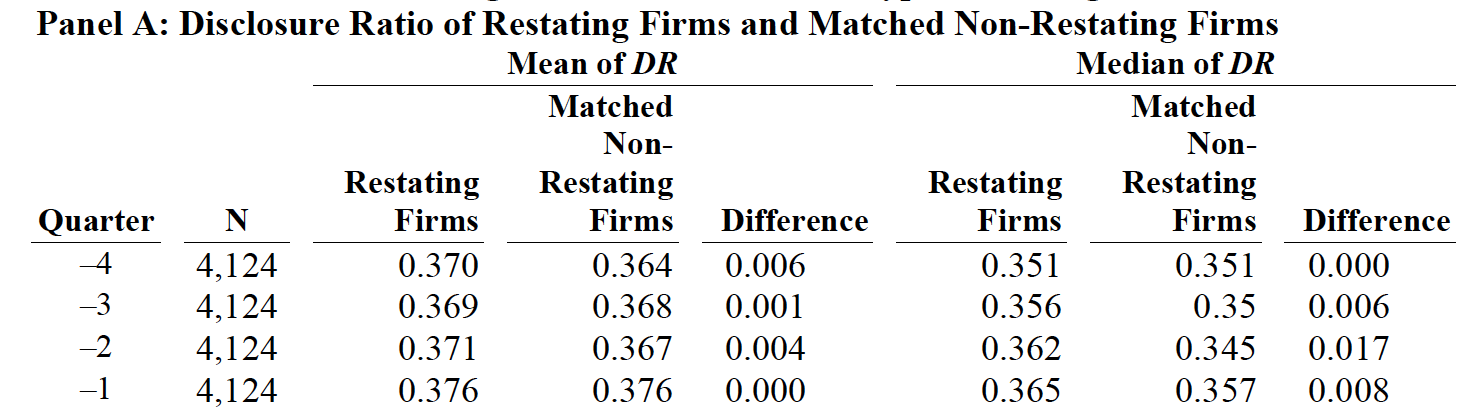
Because of this matching relationship, every event firm and its control firm will be placed in the same row in the dataset. In other words, event firms and control firms are aligned horizontally. The following codes are used for paired data. You only need to modify the first two lines to suit your data. You must specify the same number of variables in the matched order in the first two lines. In other words, the first variable in the first line must be paired with the first variable in the second line, and so on. The codes will generate a table in Stata’s output window like this:
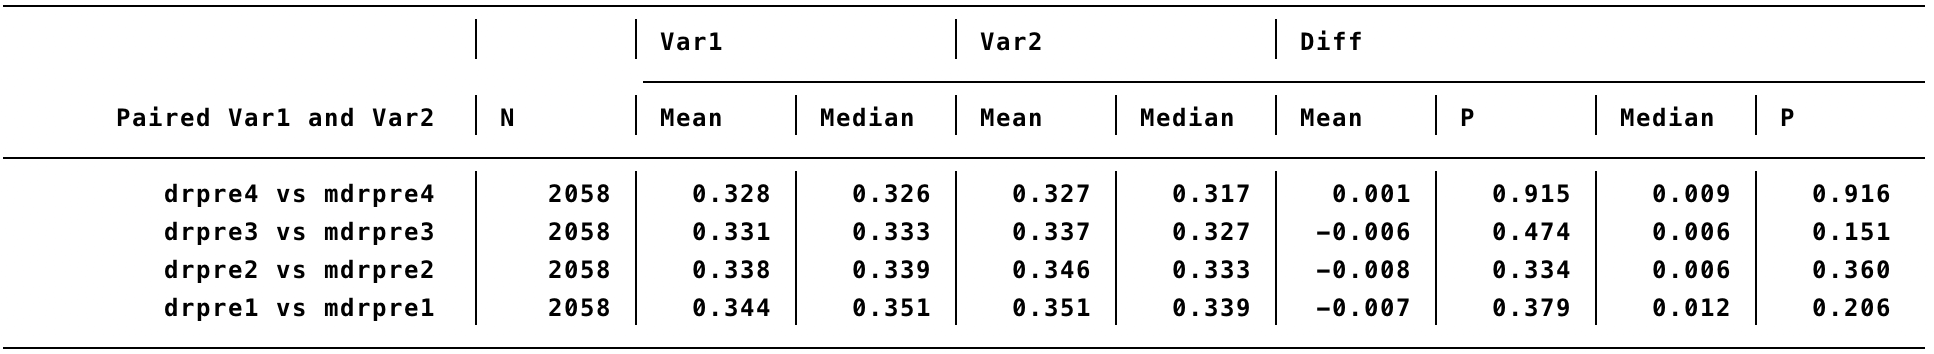
The codes use paired t-test for mean and Wilcoxon rank-sign test for median.
|
1 2 3 4 5 6 7 8 9 10 11 12 13 14 15 16 17 18 19 20 21 22 23 24 25 26 27 28 29 30 31 32 33 34 35 36 37 38 39 40 41 42 43 44 45 46 47 48 49 50 51 52 53 54 55 56 57 58 59 60 |
//put your paired variables in the first two lines. 1-to-1 correspondece is must local agrp "drpre4 drpre3 drpre2 drpre1" //e.g., treatment group local bgrp "mdrpre4 mdrpre3 mdrpre2 mdrpre1" //e.g., control group local n : word count `agrp' forvalues i = 1/`n' { local a : word `i' of `agrp' local b : word `i' of `bgrp' ttest `a'=`b' local mean_`a'=round(r(mu_1),.001) local mean_`b'=round(r(mu_2),.001) local mean_`a'_diff=`mean_`a''-`mean_`b'' local n_`a'=r(N_1) local mean_p_`a'=r(p) sum `a', detail local p50_`a'=round(r(p50),.001) sum `b', detail local p50_`b'=round(r(p50),.001) signrank `a'=`b' local p50_`a'_diff=round(`p50_`a''-`p50_`b'',.001) local p50_p_`a'=2*normprob(-abs(r(z))) } qui { noi di _newline noi di "{hline 120}" noi di _col(30) "{c |}" /// _col(40) "{c |} Var1" /// _col(60) "{c |} Var2" /// _col(80) "{c |} Diff" noi di _col(41) "{hline 80}" noi di %27s "Paired Var1 and Var2" /// _col(30) "{c |} N" /// _col(40) "{c |} Mean" /// _col(50) "{c |} Median" /// _col(60) "{c |} Mean" /// _col(70) "{c |} Median" /// _col(80) "{c |} Mean" /// _col(90) "{c |} P" /// _col(100) "{c |} Median" /// _col(110) "{c |} P" noi di "{hline 120} forvalues i = 1/`n' { local a : word `i' of `agrp' local b : word `i' of `bgrp' noi di %27s abbrev("`a' vs `b'",27) /// _col(30) "{c |}" %8.0f `n_`a'' /// _col(40) "{c |}" %8.3f `mean_`a'' /// _col(50) "{c |}" %8.3f `p50_`a'' /// _col(60) "{c |}" %8.3f `mean_`b'' /// _col(70) "{c |}" %8.3f `p50_`b'' /// _col(80) "{c |}" %8.3f `mean_`a'_diff' /// _col(90) "{c |}" %8.3f `mean_p_`a'' /// _col(100) "{c |}" %8.3f `p50_`a'_diff' /// _col(110) "{c |}" %8.3f `p50_p_`a'' } noi di "{hline 120} } |
Thank you for much for sharing this program.
You can also directly output the results to excel by using putexcel.
Just change the display to something like, putexcel A1 = “Mean” , where A1 is cell in Excel.
Some instructions:
https://blog.stata.com/2017/01/24/creating-excel-tables-with-putexcel-part-2-macro-picture-matrix-and-formula-expressions/
Thanks for your comments. However, this type of test involves extracting returned scalars from MULTIPLE commands and presenting them in a single table.
putexcelworks great if you only need returned scalars from a SINGLE command. But I am afraid it cannot pick up results from multiple commands and export them to an Excel.Good to know.
Thank you very much for the command.
Is there a way to include significance stars in the diferences (like the example from Zang, at the beginning of the post)?
Hi Kai: sorry I tested your code in Stata 14 but it was producing empty results. Is your code working for only 4 variables.
Hi George, it works for >4 variables. But you have to organize your data in certain ways and let the code know the required group variable. For example, unpaired data should be stacked by group and paired data should not.
Hi Kai:
is it possible to modify your code to include quantile regression for medians. According to Stata Journal qreg is best to use for differences in medians. https://journals.sagepub.com/doi/pdf/10.1177/1536867X1201200202
Thanks Kai: how can we export your results into Excel format.
Thanks Kai! Your code helped me get a nice table in the State output window. I’m wondering whether you have any tips for getting the table from there to Word or Excel?
Please select the output table in Stata output window. Right-click and select “Copy as Table”. Then paste it in an Excel sheet and do format there and then move it to Word.
Hi Kai,
First of all thank you very much for sharing your code and for your helpful explanations.
I would apply your code but i have two dummies one for treated/control group and one for before/after the event. Could you please help me modify this code ? My data is not matched by pairs. Thank you again
Hello everyone!!
Thank you very much for sharing.
I am trying to run the codes for unpaired data. My group variable is MNC (multinational) dummy.
However, when I run the codes I get the following error:
noi di _col(15) “{c |} `group’ = 1” ///
| MNC = 1invalid syntax
.
It is the only command that does not run so I cannot get the final table.
Do you have any idea on how I can overcome this issue?
Thank you very much for your time and consideration.
Just change the first two lines and leave other codes unchanged. The first line will be the variables that you want to compare. Change the second line to: local group MNC.
I have already changed the first two lines as you indicated in the beginning, but still there is nothing that comes to my mind that I might be missing.
Thank you 🙂
I mean, change the first two lines only. You also changed this line: noi di _col(15) “{c |} `group’ = 1” ///
| MNC = 1. Do not add | MNC = 1 at the end.
When I run this:
noi di _col(15) “{c |} `group’ = 1” ///
I get this error—->| MNC = 1invalid syntax | MNC = 1<—–
I will update you if I figure it out. Thank you for your quick responses.
Hi Kai,
Thanks heaps for sharing the code! You are a life saver!
I experienced the same problem as Vaso. I had 3 investor types – ethical, interested and conventional. I dropped all observations in the conventional group and was hoping to compare ethical investors (GROUP = 1) and interested investors (GROUP = 0). I changed the first two lines only, everything worked perfectly fine until I got an error message “GROUP = 1invalid syntax”. Not sure why this happened… I was wondering if I have missed something…
Thanks again for your help!
If you send me your data and code, I can have a quick debug.
Hi Kai,
Thanks for your help and sharing the code freely!
I have a question related to the result, how can i get the *(star marks) that indicate signifficance similar to the example that you provide in the beginning of post?
Thanks in advance!
Dear Kai,
Thank you so much for sharing this code. Unfortunately, I have the same problem as R Zhang and Vaso. I have only two groups (high and low), but I also receive the massage:
noi di _col(15) “{c |} `group’ = 1” ///
| HighAcquirerESGtotalscore = 1invalid syntax
Did you find the problem in the data from R Zhang and do you maybe have a general answer to solve this problem?
Thanks again for your help!
Hi Kai,
noi di “{hline 115}”
——————————————————————————————————————-
. noi di _col(15) “{c |} `mygroup’ = 1” ///
| TREAT //invalid syntax
I am having the same issue with the code. As suggested I modified only the first two lines of the code. My group variable is TREAT.